The Professional Futures
Trading Journal

Advanced analytics, order flow intelligence, and AI-powered insights, built exclusively for futures traders.

NinjaTrader NinjaTrader
Sierra Chart Sierra Chart
Tradovate Tradovate
Rithmic Rithmic
ATAS ATAS
CQG CQG
TradeStation TradeStation
Quantower Quantower

Everything in one place

A complete trading journal with the analytics depth that serious futures traders actually need.

Calendar View
Daily P&L at a glance with streak and drawdown tracking
Trade Log
Full history with advanced filtering, sorting, and tagging
Rule Compliance
Track violations and quantify their dollar impact
Behavior Analytics
Spot emotional and timing patterns across your trades
Order Flow
Delta imbalance, angle, and direction enriched from tick data
MFE / MAE
Measure entry and exit efficiency on every single trade

Dissect your setups

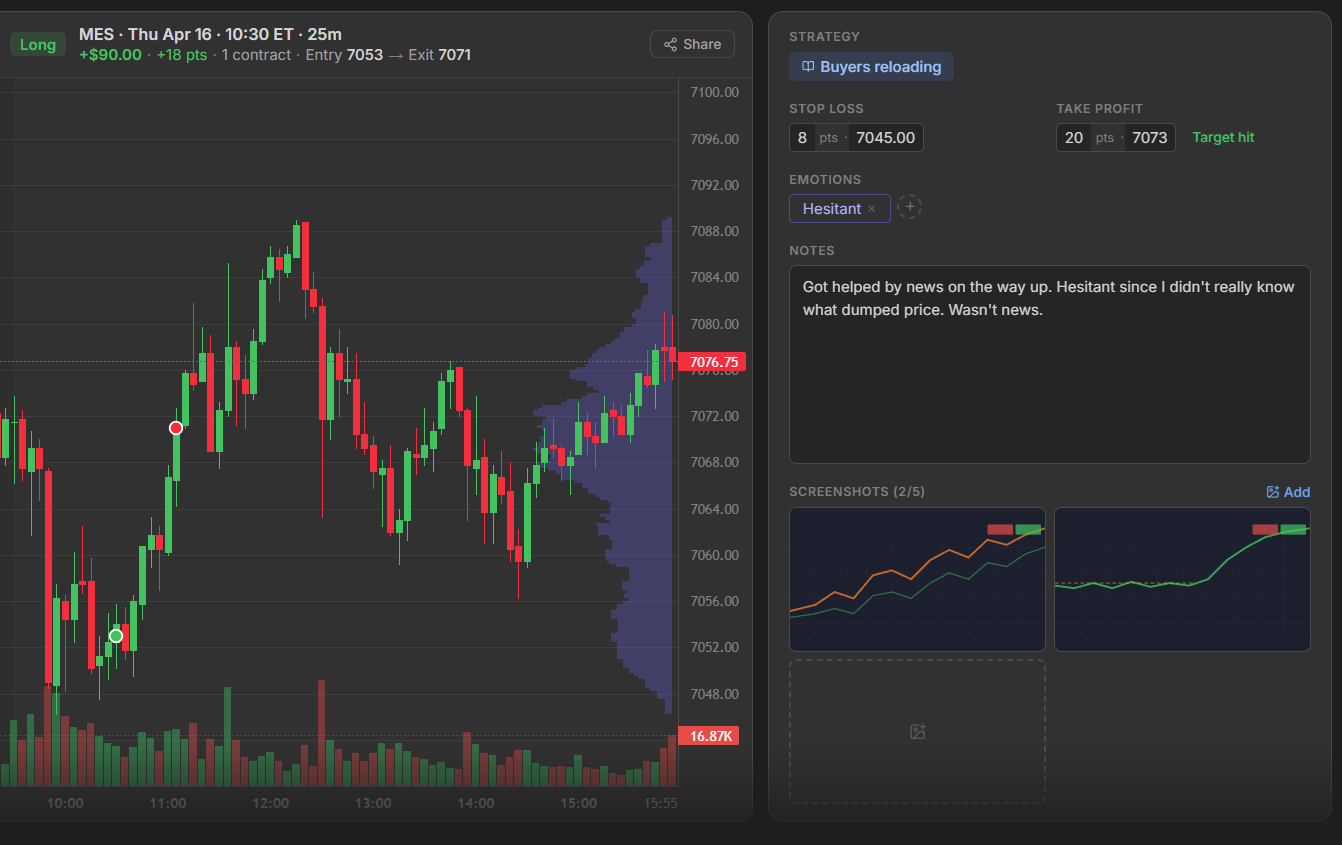
Tag and filter your trades by strategy, emotions, anything. Isolate subsets and compare their metrics to find the most profitable setups.

Trade Segmentation
A-Setup ×Pullback ×Breakout × + filter
Strategy / TagTradesWin%P&LPF
A-Setup 42 71% +$3,234 2.41
B-Setup 38 52% +$836 1.32
Pullback 24 58% +$948 1.58
Fake breakout 19 38% −$284 0.88
Sellers reloading 15 60% +$620 1.72
Rule Compliance · Cost of Violations
Rule breakCountP&L impact
Overtrading 8 −$992
Revenge trading 7 −$406
Early exit 5 −$240
Min. entry volume 4 −$618
Min. break after loss 3 −$522
Total (27 breaks) −$2,778

Improve your discipline

Create rules and track every violation. Visualize breaks impact on your P&L and monitor your improvement over time.

Improve your exits

MFE/MAE plots every trade's maximum favorable and adverse excursion, so you can see exactly how far price moved in your favor before you got out.

Find your order flow edge

Cross your entries with real tick-by-tick delta. Know instantly whether you traded with or against the tape, and what that means for your win rate and P&L.

Find your optimal risk parameters from real data

Simulate thousands of combinations of stop loss, take profit and breakeven rules against your entries. Find the optimal parameters that would have worked best for your strategy.

TP / SL Matrix · Simulated P&L
Applied to 162 historical trades on 1s candle data
TP\SLSL 4SL 6SL 8SL 10SL 12
TP 4
-820
-340
+120
+280
-180
TP 6
-440
+280
+840
+720
+380
TP 8
-120
+640
+1.5k
+1.3k
+880
TP 10
-280
+420
+1.2k
+2.0k
+1.2k
TP 12
-620
+180
+820
+1.5k
+1.8k

Start trading smarter today

Free to start. No credit card required.

Join the Beta